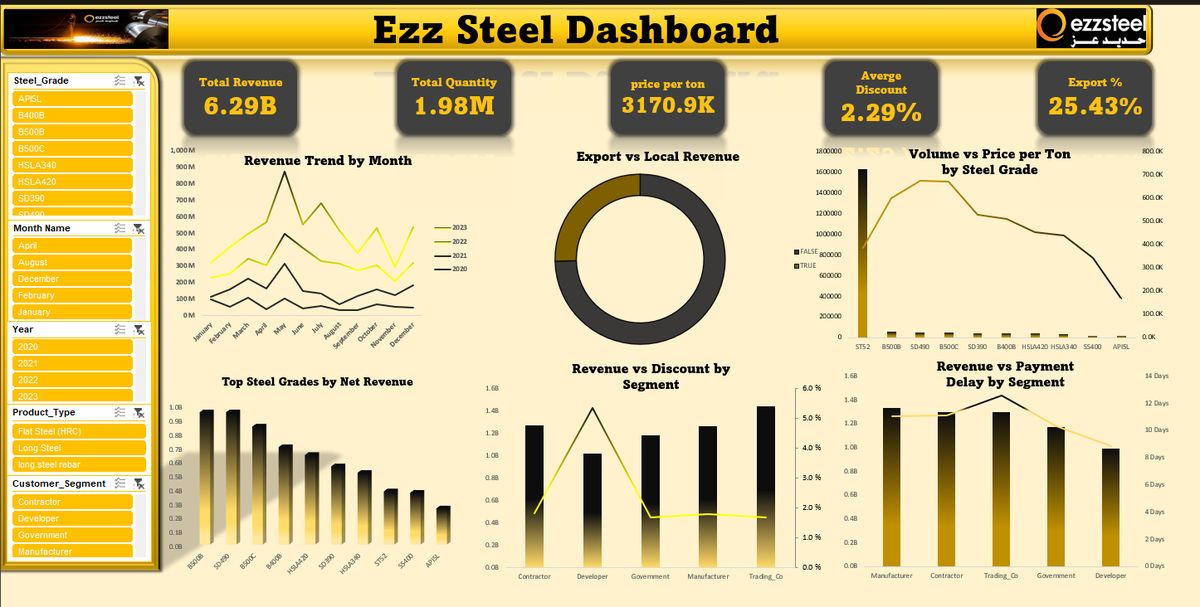
EZZ Steel — Production Analytics
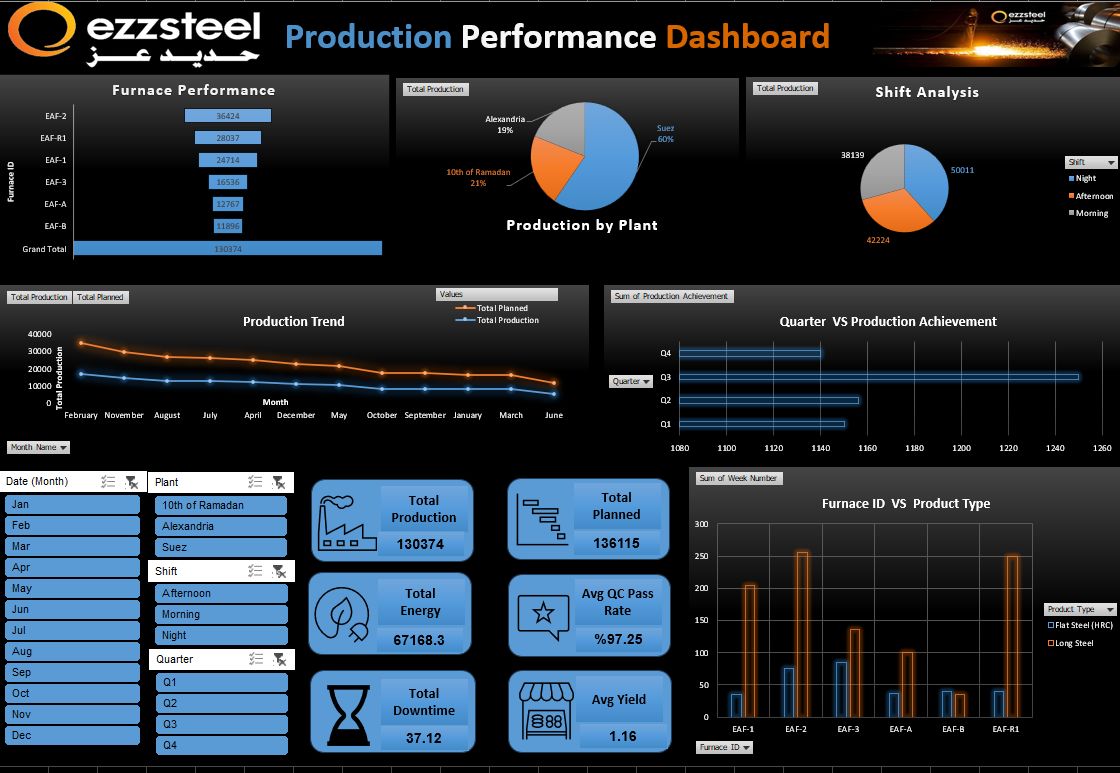
Compare planned vs. actual production across plants, furnaces, and shifts.
I'm Omar AbdElpaq. I clean the mess, model the numbers, and build dashboards that tell people what's actually happening in the business — before they have to ask.
Power BI
SQL
Excel
Python
I'm an undergraduate student at Menoufia National University, Faculty of Computers and Artificial Intelligence, majoring in Internet of Things & Big Data Analytics.
I completed the Data Analytics Summer Training run by NTI in cooperation with ITIDA, and I've since taken on practical, freelance/task-based Data Analytics work — cleaning data, building BI dashboards, and turning raw datasets into decision-ready reporting.
I'm currently developing Data Engineering as an additional specialization through DEPI. What draws me to this field is simple: turning raw data into insight that people can actually act on.
As responsible for Data & Business Intelligence at Voltix, I build the company's analytical foundation through dashboard development and performance and market analysis to support product and business decisions. I also contribute to content strategy and company positioning, while supporting the early operational build-out of the startup alongside a cross-functional team covering Backend, Frontend, Cybersecurity, and UI/UX.
Practical, task-based analytics work for independent clients: data cleaning and preparation, KPI analysis, and BI dashboard development using Excel, Power BI, SQL, and Python — turning raw, inconsistent datasets into reporting people actually use.
Supported general IT and software development activities as part of the team, contributing to day-to-day technical and software-related operations. Gained practical exposure to supporting technical tasks and maintaining reliable software-related workflows.
Six case studies covering operations, finance, retail, HR, and healthcare analytics.

Compare planned vs. actual production across plants, furnaces, and shifts.

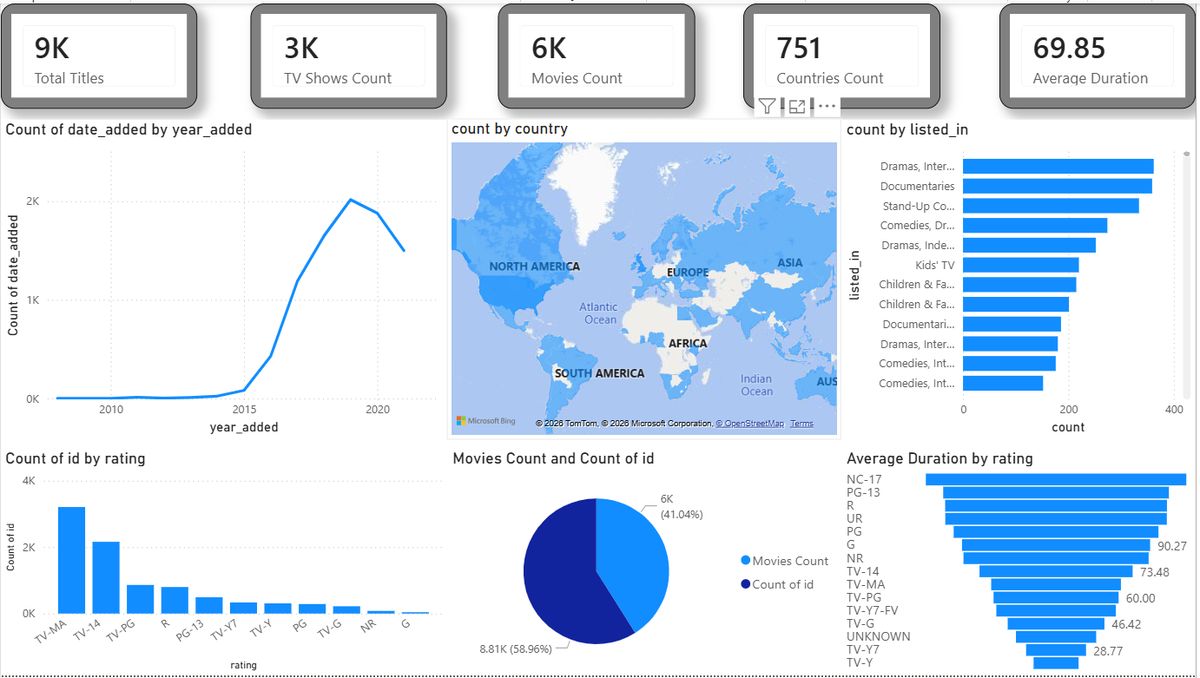
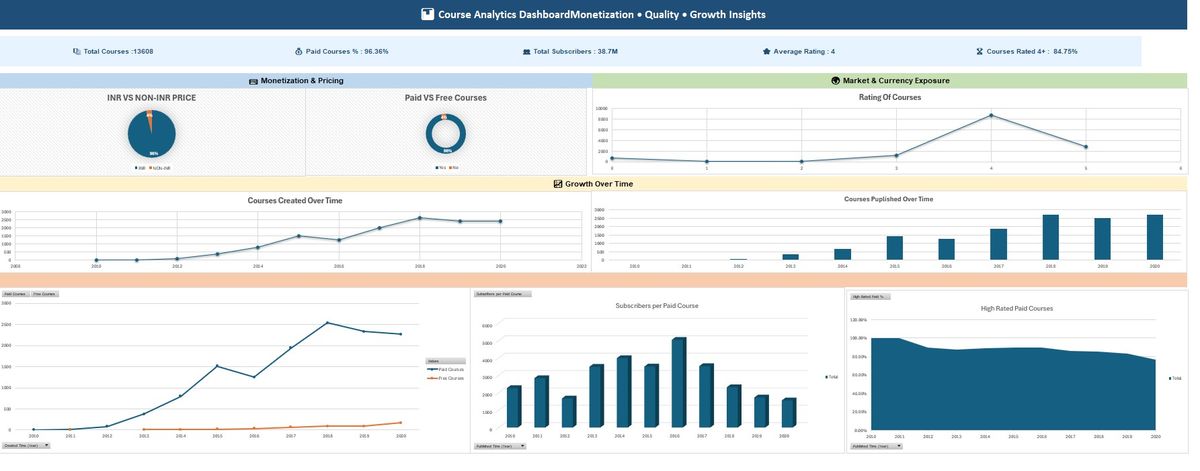
Clean and structure raw catalog data to analyze content mix and ratings.

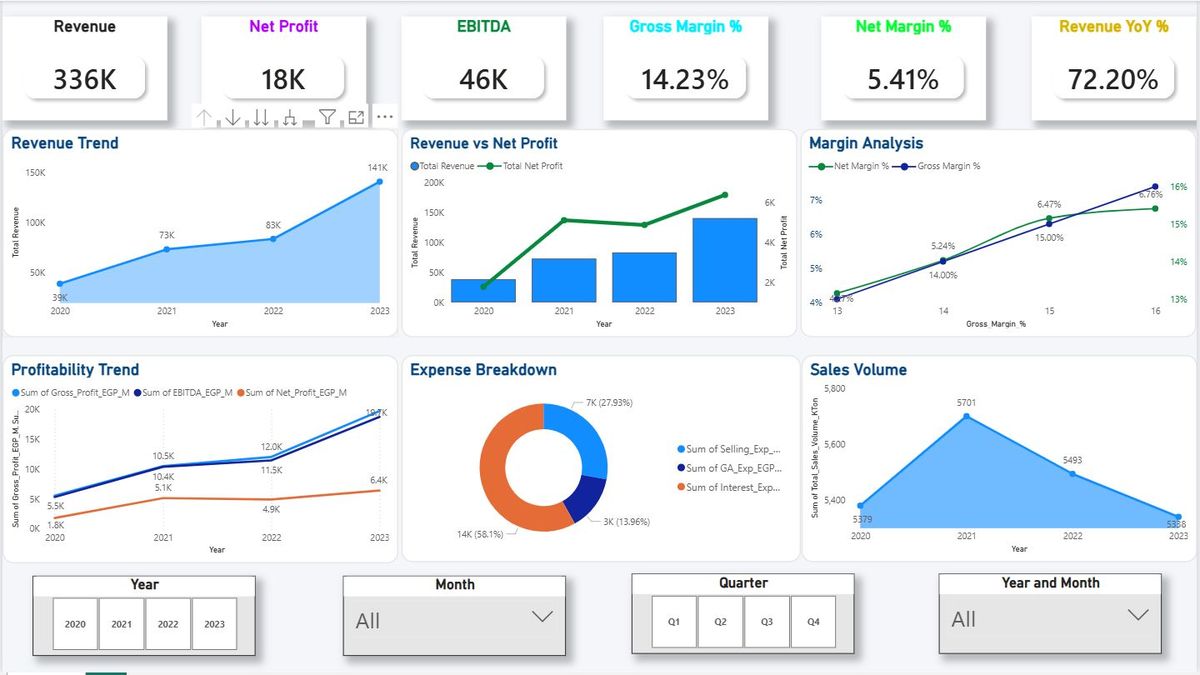
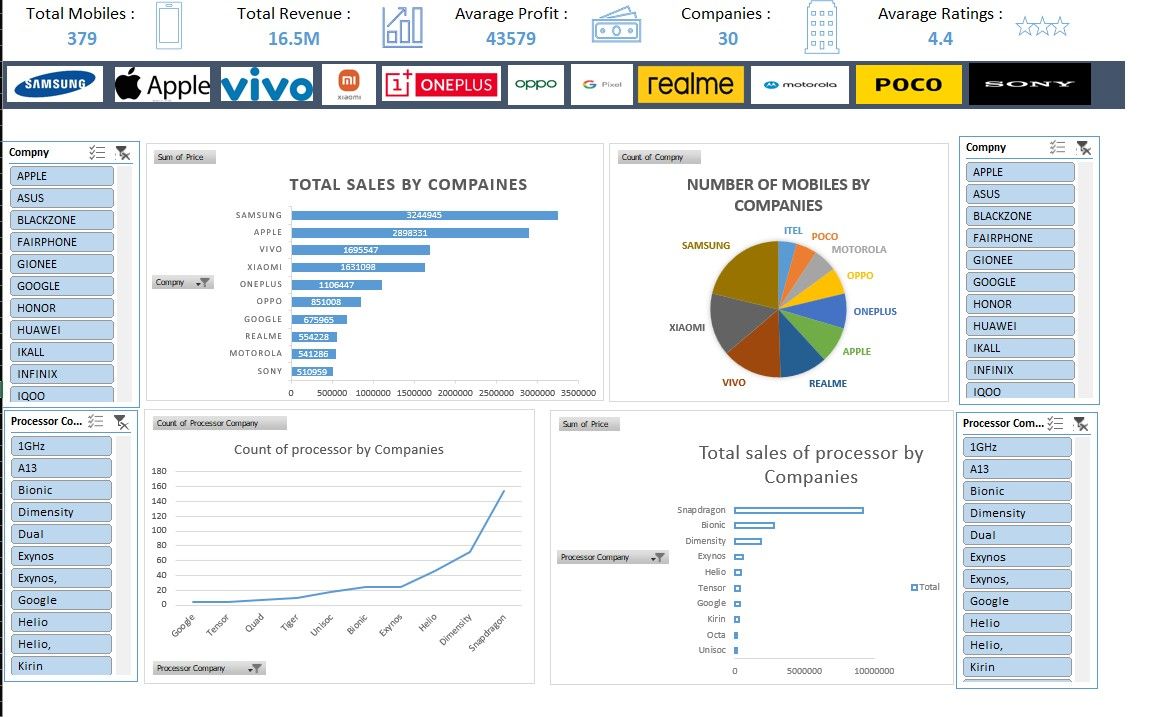
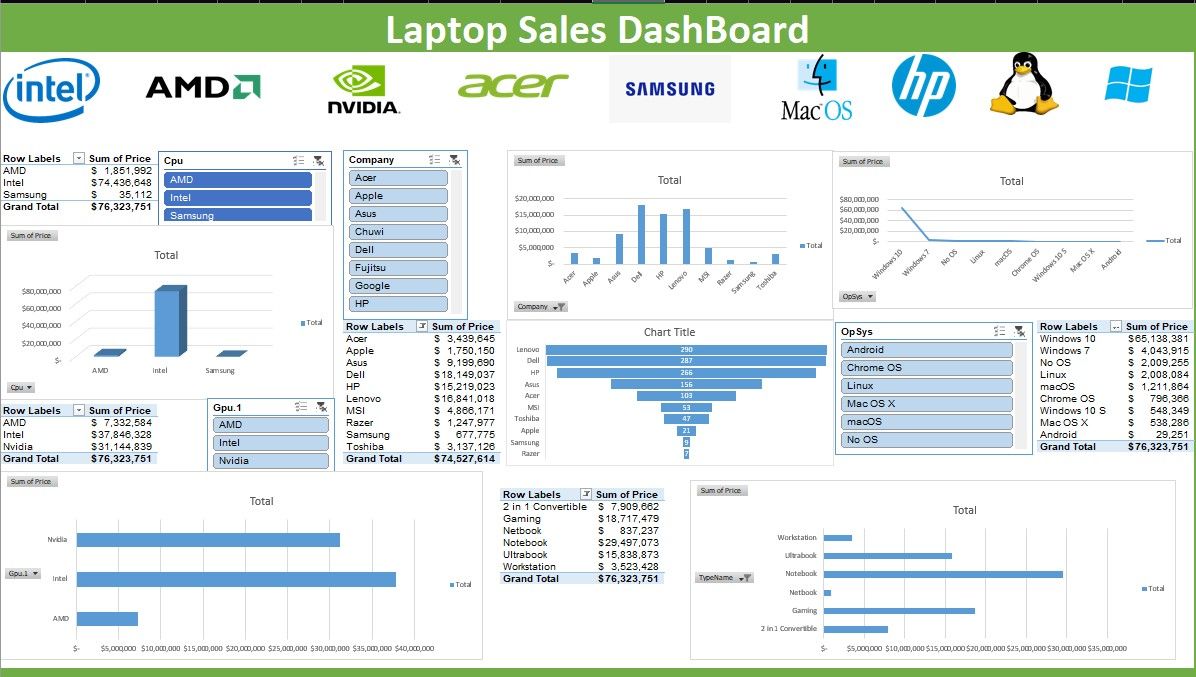
Track revenue growth and profitability trends over time.

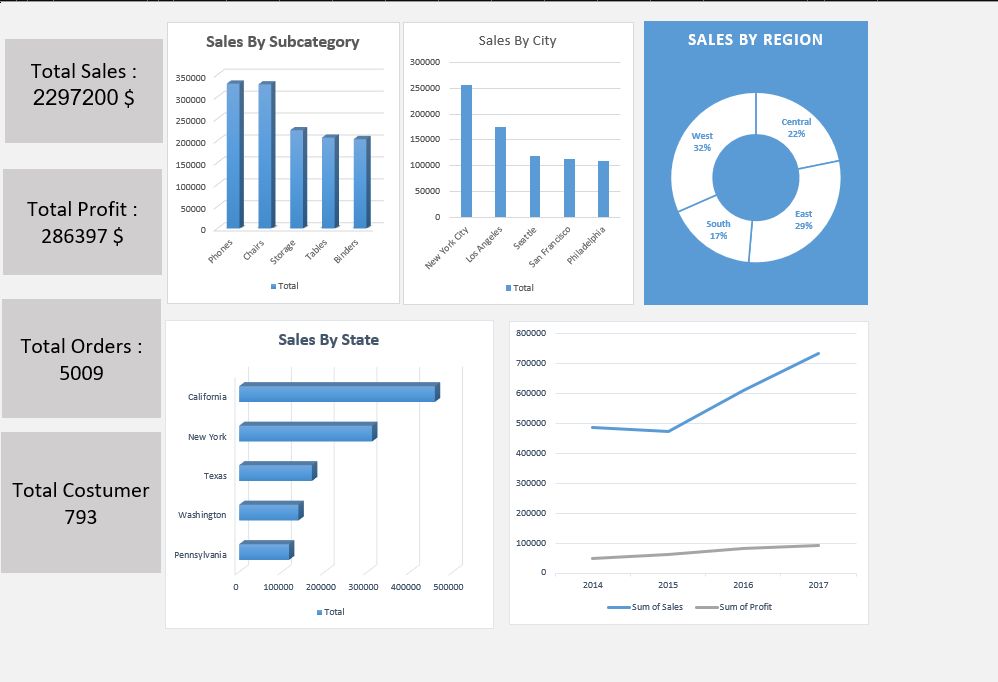
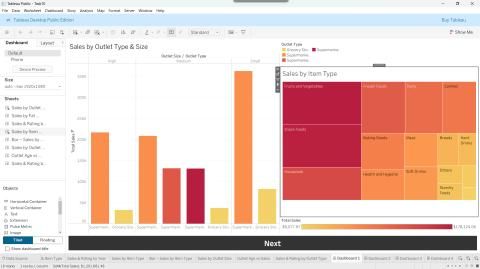
Identify which regions and categories drive sales and profit.

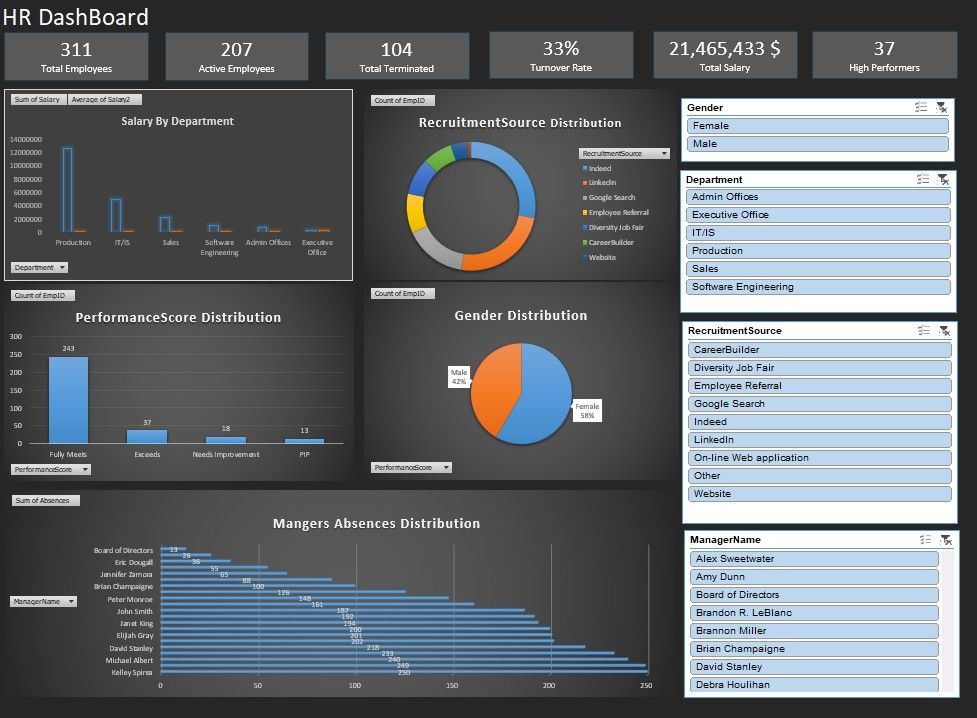
Give HR one view of headcount, turnover, and performance ratings.

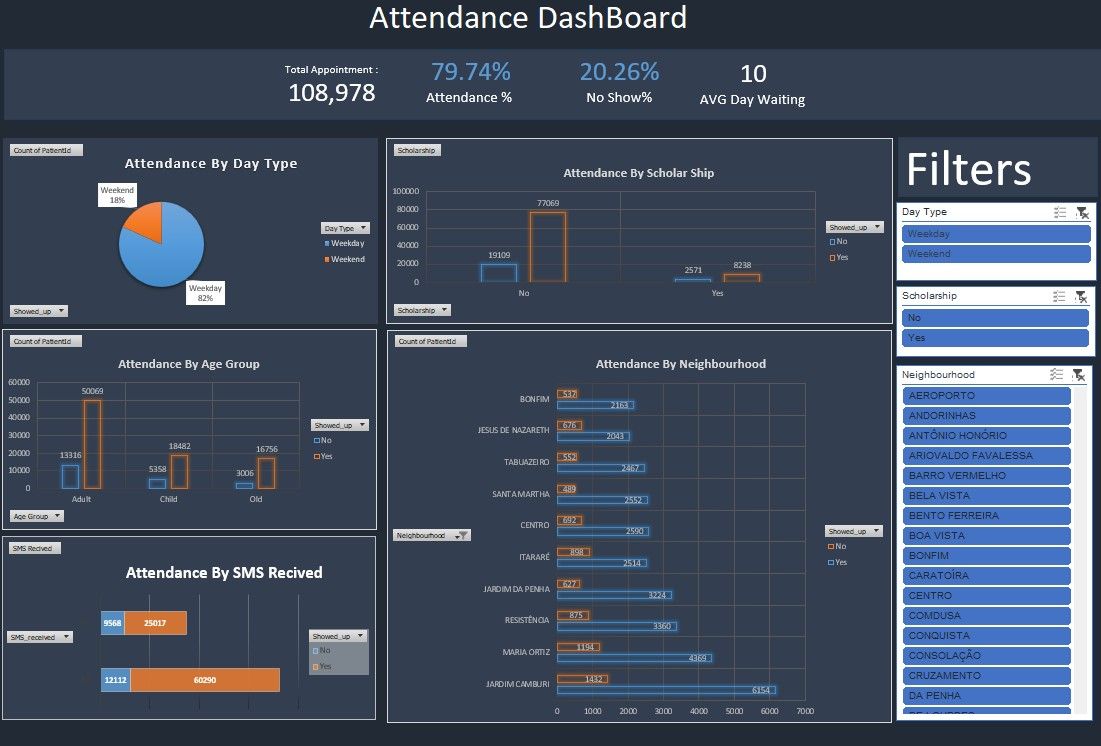
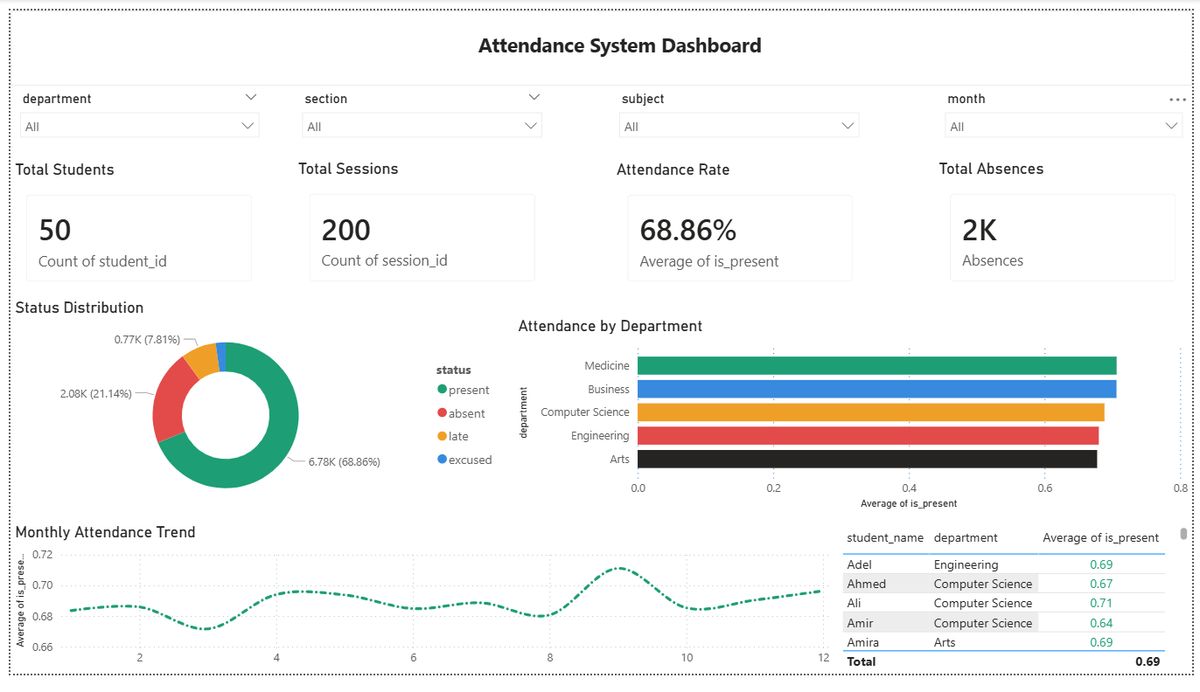
Understand attendance patterns behind missed appointments.
Earlier web/CRM development work, built during freelance and task-based projects — shown here separately from my Data Analyst focus.
31 August – 25 September 2025 · 120 hours (90 technical + 30 freelancing)
Additional specialization — Data Engineering, Microsoft Data Engineer Track
Interactive dashboards, KPIs, DAX, and reporting built around the questions your team actually asks.
Power Query, Power Pivot, DAX, PivotTables, and dashboards for teams that live in Excel.
Queries, joins, aggregations, and PostgreSQL work aimed at business-focused questions.
Pandas-based pipelines that turn raw, inconsistent files into analysis-ready datasets.
Have data that needs to become useful? Let's talk.
Let's Talk